

In today’s data-driven world, organizations are constantly seeking ways to transform their raw data into valuable insights. This is where Power BI comes into play. Developed by Microsoft, Power BI offers powerful tools for data shaping and report creation, enabling businesses to unleash the true potential of their data. In this article, we will explore the concept of data shaping in Power BI, its significance, and the most common techniques used to make data work for you.
Understanding Data Shaping
Data shaping is the process of transforming raw data into usable queries, allowing you to manipulate and present the data in a way that suits your needs. By applying various shaping techniques, you can change the structure and format of your data, making it more meaningful and easier to analyze. It’s important to note that data shaping does not alter the original data source; it only affects the presentation of the data.
The Power Query Editor: Your Gateway to Data Shaping
When working with Power BI, the Power Query Editor window serves as your primary tool for data shaping. Within this space, you can utilize a range of techniques available on the “Transform” ribbon or by right-clicking on specific data presentations. Let’s explore some of the most common data-shaping techniques in Power BI.
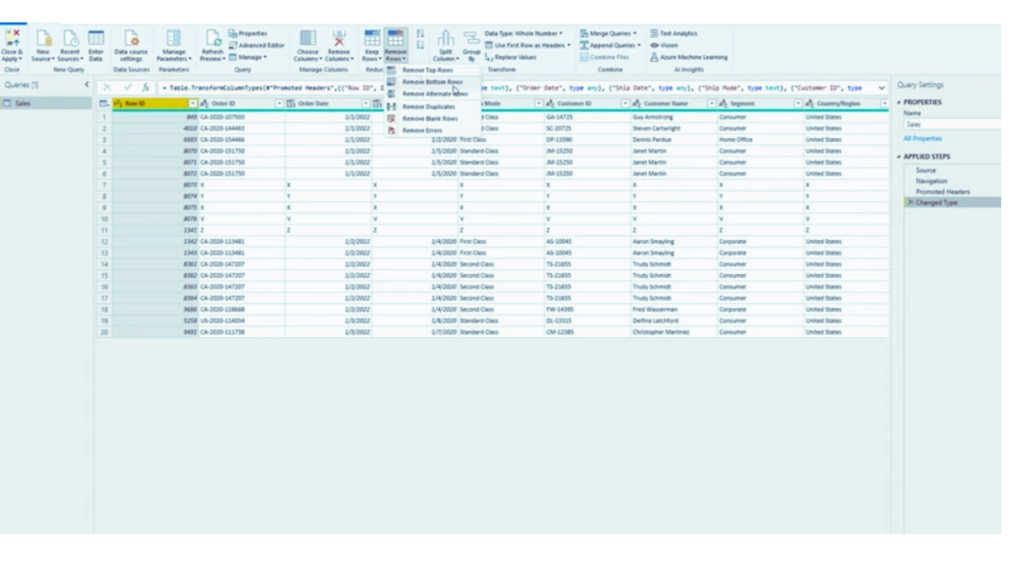
Removing Columns and Rows
One of the fundamental data shaping techniques is removing unnecessary columns and rows from your tables. This is particularly useful when dealing with large datasets or when certain columns or rows do not contribute to your analysis. To remove columns and rows in Power BI:
- Select the column or row you want to delete.
- Navigate to the “Home” tab.
- Click on “Remove Columns” to eliminate the selected element.
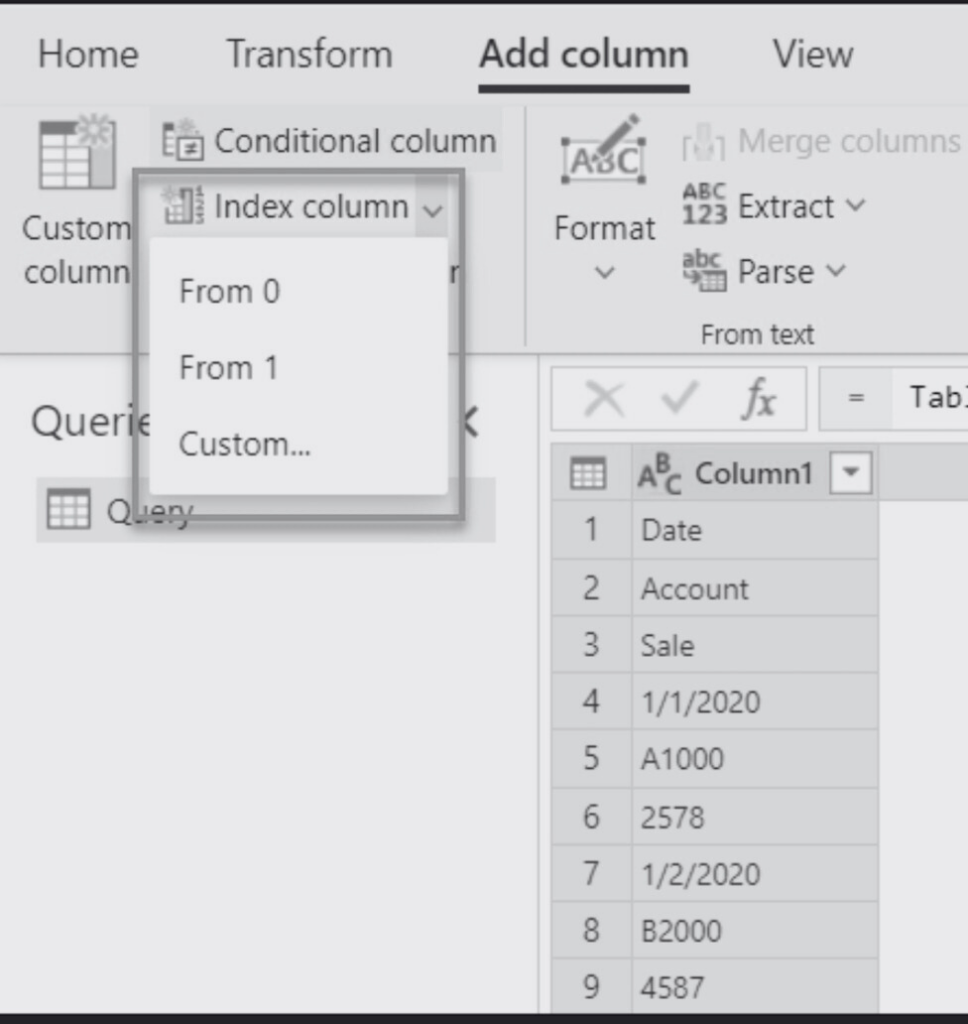
Adding Index Columns
Adding an index column to your table allows you to view your data in a numerical order, similar to an index in a book. This makes it easier to locate specific data points and facilitates data exploration. To add an index column in Power BI:
- Click on the “Home” tab.
- Open the “Edit Queries” option to access the Queries panel.
- Select the table you wish to index.
- Click on “Add Column” and choose “Index Column.”
- Once completed, click on “File” and then “Close and Apply” to apply the changes.
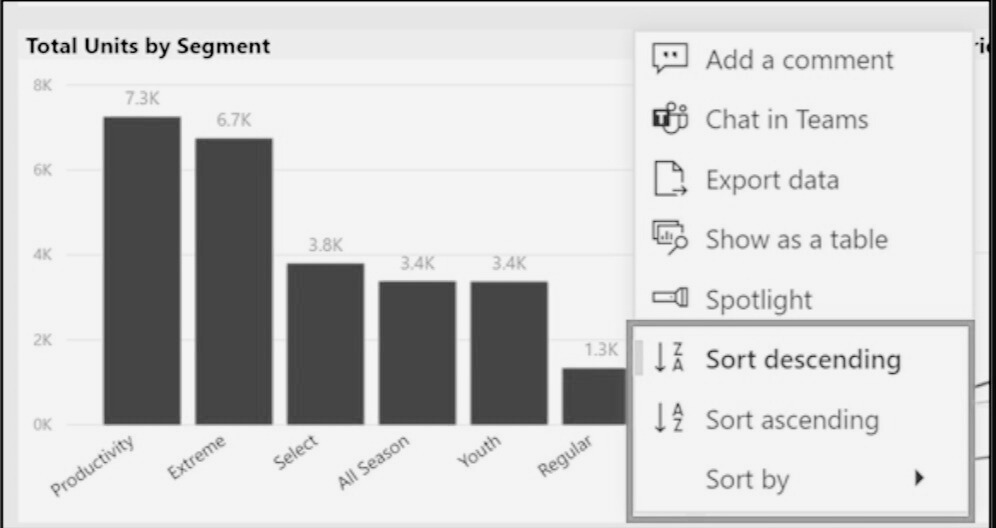
Implementing a Sort Order
Customizing the sort order of your data enables you to highlight the most relevant information for your analysis. By specifying how your data should be sorted, you can emphasize key insights and make your reports more impactful. To implement a sort order in Power BI:
- Open the visual that you want to sort.
- Locate the “More Options” (ellipsis) button.
- Select “Sort By” and choose your preferred sorting order.
Data Shaping vs. Data Modeling and Combining Data
As you delve deeper into data shaping, you may come across terms such as “data modeling” and “data combining.” It’s important to understand the distinctions between these concepts in the context of Power BI.
Data Shaping: Presenting Your Data
Data shaping primarily focuses on how you present your data. It involves techniques to transform and structure the data in a way that enhances its readability and relevance. By shaping the data, you can emphasize key insights and communicate the information effectively.
Data Modeling: Building Relationships
Data modeling, on the other hand, revolves around establishing relationships between different data tables. It enables you to define connections and hierarchies, allowing for a holistic view of your data. By modeling the data, you can uncover complex relationships and gain deeper insights into your business processes.
Combining Data: Consolidating Sources
Combining data involves bringing together multiple data sources to create a unified dataset. This can be achieved through merging or appending data from different sources. By combining data, you can perform comprehensive analysis and gain a more comprehensive understanding of your business operations.
Conclusion
Data shaping is a crucial step in unlocking the true potential of your raw data. With Power BI, you have a powerful set of tools at your disposal to transform, manipulate, and present your data in a meaningful way. By removing unnecessary columns, adding index columns, and implementing sorting orders, you can create visually appealing and informative reports that drive actionable insights. Additionally, understanding the distinctions between data shaping, data modeling, and data combining empowers you to leverage Power BI to its fullest extent. So, start shaping your data today and uncover the hidden value within!