

Introduction
Data Analysis Expressions (DAX) is a powerful formula language used in Power BI Desktop to create calculations and solve data analysis problems. In this article, we will provide you with a quick and easy introduction to DAX, covering its fundamental concepts, syntax, functions, and context. By the end of this article, you will have a good understanding of how to leverage DAX to extract valuable insights from your data.
What is DAX?
DAX stands for Data Analysis Expressions, and it is a collection of functions, operators, and constants that can be used to calculate and return one or more values. DAX allows you to create new information from the data already in your model. It is an essential tool for performing complex calculations and data analysis in Power BI Desktop.
Why is DAX Important?
While it is possible to create reports and visualizations in Power BI Desktop without using any DAX formulas, DAX becomes crucial when you need to analyze and calculate more advanced metrics and perform complex calculations. DAX enables you to calculate growth percentages, compare data across different time periods, and perform other important calculations that help you gain deeper insights into your data. By mastering DAX, you can unlock the full potential of Power BI Desktop and solve real business problems that impact your bottom line.
Prerequisites
To understand DAX, it is helpful to have some familiarity with creating formulas in Microsoft Excel. However, even if you have no experience with Excel formulas, the concepts we will cover here will enable you to start creating DAX formulas and solving real-world business intelligence (BI) problems right away. You should also be familiar with using Power BI Desktop to import data and add fields to a report, as well as the fundamental concepts of measures and calculated columns.
Syntax
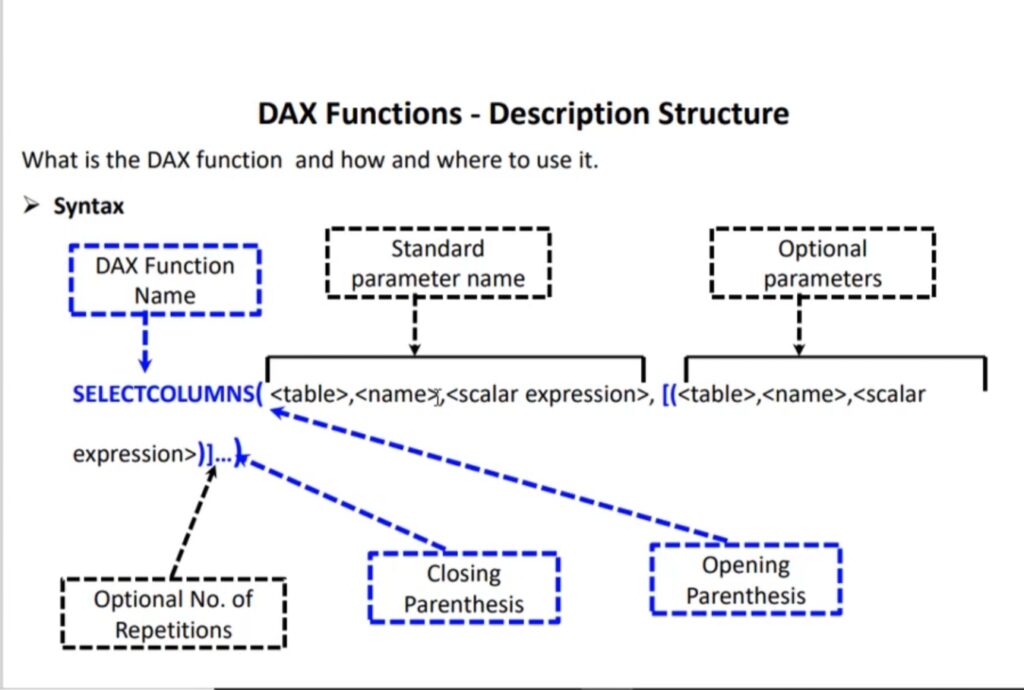
The syntax of a DAX formula consists of various elements that make up the formula. These elements include the measure name, operators, functions, and column references. Understanding the syntax is crucial for creating effective DAX formulas. Let’s break down a simple DAX formula to illustrate the syntax:
Total Sales = SUM(Sales[SalesAmount])
In this formula, the measure name is “Total Sales,” and it is calculated using the SUM function, which adds up all the values in the Sales[SalesAmount] column. The Sales table is referenced using the table name followed by the column name. Understanding the syntax of DAX formulas allows you to create powerful calculations and manipulate data effectively.
Functions
DAX includes a wide range of predefined functions that perform calculations and manipulations on data. These functions can be used to perform various tasks, such as aggregating values, filtering data, manipulating strings, and working with dates and times. DAX functions can be categorized into different categories, including date and time functions, information functions, logical functions, mathematical functions, statistical functions, text functions, and more.
For example, the SUM function we used in the previous section is a mathematical function that calculates the sum of values in a column. Other commonly used functions in DAX include AVERAGE, MAX, MIN, COUNT, and CALCULATE. Each function has a specific purpose and syntax, and understanding how to use these functions is essential for creating powerful DAX formulas.
Context
Context is a fundamental concept in DAX that determines how calculations are performed based on the specific context in which they are evaluated. There are two types of context in DAX: row context and filter context.
Row context refers to the current row being evaluated in a table. It applies to calculations performed on individual rows, such as measures. For example, when calculating a measure for each row in a table, DAX applies row context to perform the calculations.
Filter context, on the other hand, involves applying one or more filters to a calculation to narrow down the data that is used in the calculation. Filters can be applied through visualizations, relationships, or explicit DAX functions like CALCULATE and FILTER. Filter context allows you to specify the subset of data that you want to include in your calculations.
Understanding and managing context is crucial for creating accurate and meaningful calculations in DAX. It allows you to perform calculations based on specific criteria, such as filtering data by date range or product category.
Applying DAX in Power BI Desktop
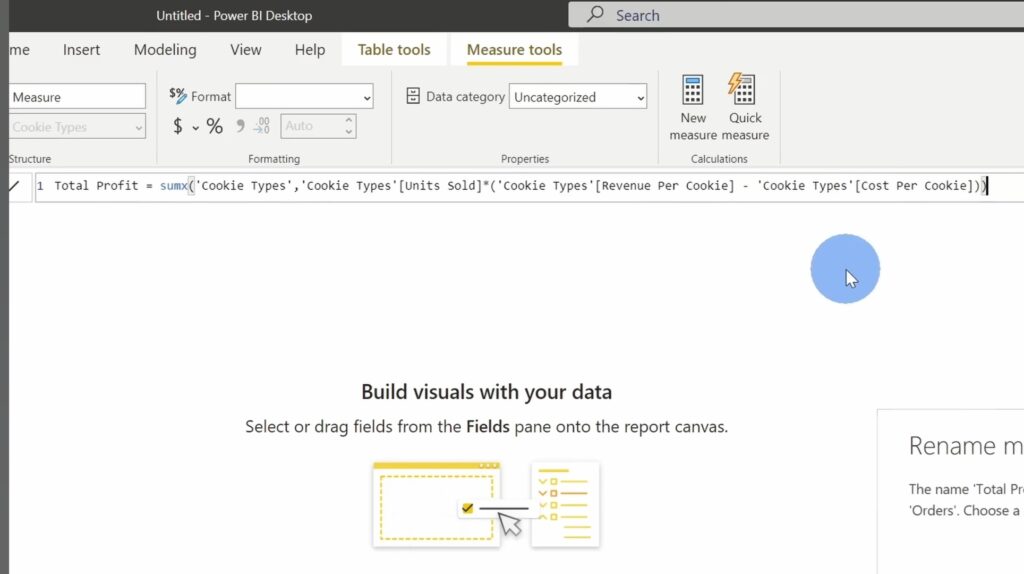
Now that you have a basic understanding of DAX, let’s explore how you can apply it in Power BI Desktop to solve real-world BI problems. Power BI Desktop provides a user-friendly interface for creating and managing DAX formulas. You can create measures, calculated columns, and calculated tables using the DAX formula bar.
To create a measure, you can use the DAX functions and operators to define the calculation based on your specific requirements. Measures are typically used to aggregate and summarize data. For example, you can create a measure to calculate the total sales, average revenue, or maximum profit.
Calculated columns, on the other hand, allow you to add new columns to your table by defining a DAX formula. Calculated columns are useful when you need to perform calculations that involve multiple columns in a table. For example, you can create a calculated column to calculate the profit margin based on the sales and cost columns.
In addition to measures and calculated columns, you can also create calculated tables using DAX. Calculated tables are tables that are derived from existing tables in your data model. They allow you to create new tables that contain calculated results based on the data in your model.
To create DAX formulas in Power BI Desktop, you can use the formula bar located at the top of the screen. The formula bar provides a user-friendly interface for entering and editing DAX formulas. It also includes features like auto-complete and syntax highlighting to help you write DAX formulas more efficiently.
Once you have created your DAX formulas, you can use them in visualizations to analyze and visualize your data. Power BI Desktop provides a wide range of visualizations, such as charts, tables, and maps, that allow you to explore and present your data in meaningful ways. By combining DAX formulas with visualizations, you can gain valuable insights and communicate your findings effectively.
Conclusion
DAX is a powerful formula language that enables you to perform complex calculations and data analysis in Power BI Desktop. By understanding the fundamental concepts of DAX, mastering its syntax and functions, and leveraging the power of context, you can unlock the full potential of Power BI Desktop and solve real business problems.
In this article, we have provided you with a quick overview of DAX basics, including its purpose, syntax, functions, and context. We have also discussed how you can apply DAX in Power BI Desktop to create measures, calculated columns, and calculated tables. By combining DAX with visualizations, you can gain deeper insights into your data and make data-driven decisions.